Too rare
A bed that starts to sinter, a bad fuel batch or a stone heading for the chipper happens a few times a year. Nobody can stare at a monitor for months waiting for it.

Machine vision for biomass power plants & pulp and paper mills
Photoboiler measures what your operators can only watch: fuel and bed quality at biomass boilers, bark and wood loss in the wood room. Results go into your automation system like any other measurement, with an evidence image behind every value and alarm.
Sounds familiar?
Fuel feeds, ash conveyors, debarking lines and bunkers are still mostly watched by operators looking at security camera feeds. That works – until it doesn't.
A bed that starts to sinter, a bad fuel batch or a stone heading for the chipper happens a few times a year. Nobody can stare at a monitor for months waiting for it.
A change in the fuel or the log feed reaches the next process step in minutes. By the time the boiler or the line reacts, it's too late to act.
Watching fuel or logs stream past for a whole shift is exactly the job people are worst at. Attention fades. A camera's doesn't.
Purpose-built analysers are expensive, single-purpose – and often simply don't exist for the problem you actually have. Photoboiler closes the gap: a rugged camera rig plus a model trained on your material, turning images into early warnings, trends and evidence your whole team can trust.
Applications
Real detections from real plants: the raw camera image next to what the model finds in it. Pick your industry.
Fuel feed, fluidised bed and bottom ash.


Wood handling first – and other mill processes where standard measurement devices don't work.

Stones and other unfamiliar material on the debarking conveyor, detected before they reach the chipper – with an alarm signal to your automation system.
Log build-up, misaligned and bridging logs on the feed conveyor, with early-warning alarms before a full jam. Often works with a standard security camera.
Log thickness and length, and volume flow from belt speed, for continuous monitoring of debarking line production.
Sludge sticking to the wire, overflow beyond the wire and wire position, for stable dewatering.
Damaged end covers, wrinkled or torn wrapping and missing labels on finished rolls, before they go to storage or delivery.
The foreign-object detection and conveyor condition monitoring described above work on mill conveyors too.
Beyond our core, we take on new targets together with customers who want to develop them. Results depend on the case, so we agree the goal and the success criteria with you up front – and tell you honestly if it isn't working.
Unexpected objects in RDF/SRF and other recovered fuels, flagged with an image as evidence.
Oversized items in waste bunkers and at reception, spotted before they block the feed.
If an experienced operator can spot it on camera, a model can often learn to measure it. Tell us about it →
The rig
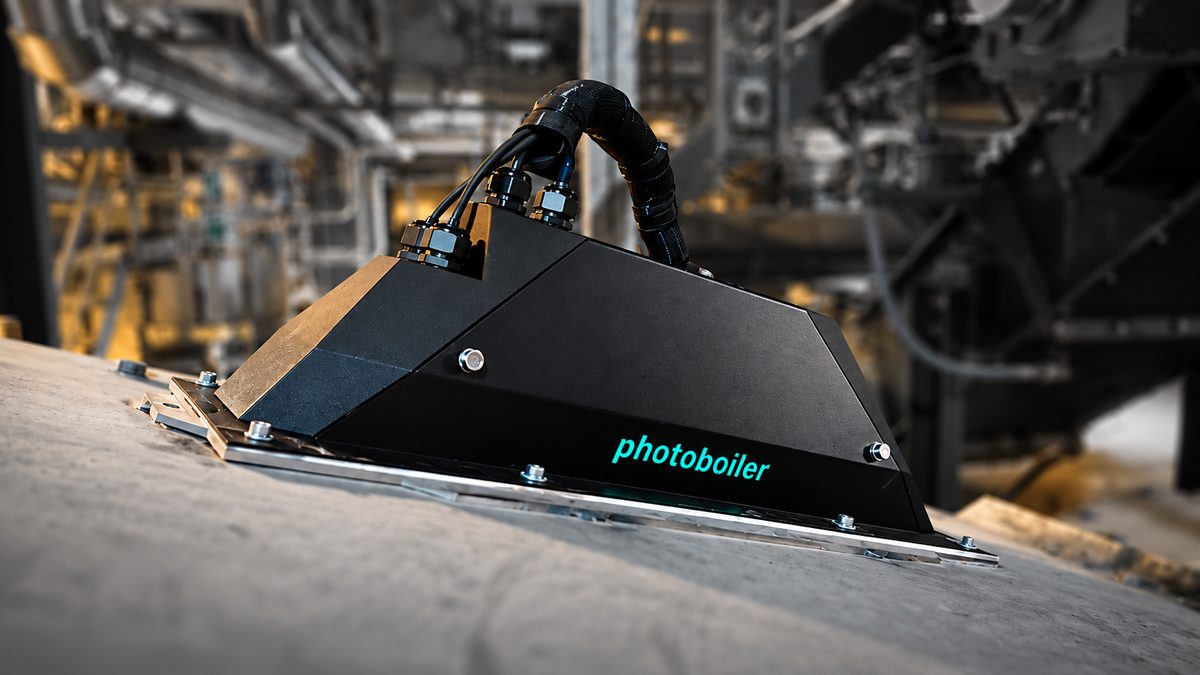
Measurement-grade machine vision needs a steady view and steady light. Dust, moisture and vibration make both hard. That's why we build our own rig.
Bolts straight onto conveyor covers, chutes and hatches. Camera, optics and electronics stay sealed away from dust and moisture.
Controlled illumination gives consistent images day and night – the difference between a picture and a measurement.
Power and data in a single protected cable run. We deliver the rig with its installation plates, and your own maintenance staff mount it in a short stop – usually 1–2 hours, with us there to help.
A transmitter box next to the rig sends images to our servers through its own modem and VPN – no server or network needed from you. For very fast response, the analysis can run right there at the edge.


Why operations managers invest
How we work
Low risk, step by step. Start with one camera on one line, and expand once it has paid back. You decide at every stage based on results from your own process.
We walk your fuel handling, boiler house or wood room with your team. We find where vision pays back fastest, check what you can actually do with the result – and tell you if it isn't a fit.
One rig on one target, on your own material. We agree success criteria up front and compare the results with your existing process data.
Measurements and alarms go into your automation system like any other signal, with the evidence image behind each one – no extra screen to watch.
We check measurements and cameras every month, and recalibrate the models when your material, light or camera changes.
Analysis runs on our servers in Finland or Sweden. The transmitter box connects through its own modem and VPN, so you don't need to provide a server or network. Prefer your own server? The same system runs there too.
We write results to your system over OPC UA, or you read them from our OPC UA server or REST API. Traditional mA signals work too. Images and trends are in a web interface.
We deliver the rig, installation plates and transmitter box. Your own maintenance staff mount them and bring power – usually 1–2 hours in total, with us there to help. The conveyor only needs to stop for the 10–20 minutes of work over it, which fits in a normal short stop.
Monthly health checks, model recalibration and updates are part of the service. Support in Finnish business hours.

Proven on site
At Pori Energia, continuous camera-based monitoring of critical fuel conveyor equipment helps secure plant availability. Our applications have been developed with operators of Finnish biomass power plants and the forest industry – in real dust, real heat and real winters.
Behind it is roughly twenty years of hands-on experience in industrial data analytics and machine vision projects, especially in power plants and forest industry.
FAQ
Dust, changing light and varying material are what usually make plant cameras unreliable. Our rig has its own lighting and a fixed view, so the images stay comparable shift after shift. Before you commit, the proof of concept runs on your own material and is checked against your existing process data – so you see what it detects, and what it doesn't, before investing further.
Then it isn't worth doing, and we'll say so. In the site assessment we go through what can actually happen after an alarm – an operator action, a feed or air adjustment, a sand change, supplier feedback – and pick targets where the answer is clear.
It should take work away. Measurements and alarms arrive in your automation system like any other signal, with the image behind each one. Hardware, servers and models are maintained by us.
We're happy to work alongside them. What we bring is a camera rig built for dusty process environments, images and experience from similar plants, and models that are maintained over time. Results are open to your own systems through OPC UA and a REST API, so your engineers can focus on using them to optimise the process.
Yes – that's the usual way. One camera on one target, and expand to more lines once the first one has paid back. A second application can often use a camera that's already installed – for example, stone detection on the debarking camera.
We deliver the rig, its installation plates and a transmitter box. Your own mechanical and electrical maintenance staff mount them and bring power – usually 1–2 hours of work in total, with us there to help. Only the work over the conveyor needs it stopped, typically 10–20 minutes once everything else is ready – about as long as a normal short conveyor stop. In our hosted setup you don't need to provide a server or a network connection, and in the best cases everything is up and running within a few days.
Sometimes. Some applications, such as log jam warning, often work with a standard security camera. Reliable measurement usually needs a fixed view and controlled lighting – which is why we built our own rig. We'll tell you honestly during the assessment.
Into your automation system (DCS), as normal measurement signals and alarms. We can write them to your system over OPC UA, you can read them from our OPC UA server or REST API, or we deliver traditional mA signals. The images behind every value are in a web interface.
Usually on our servers in Finland or Sweden. A transmitter box next to the camera connects to them through its own modem and VPN. For very fast response, the analysis can run on the edge computer in that box. And because everything runs in containers, the whole system can also run on your own server if you prefer.
Model accuracy can drift when your material, lighting or camera changes – that's normal. We check measurements every month and recalibrate the models with new images from your site when needed. That's part of the service, not a one-off project.
Yes, as development projects. Waste and recovered fuels vary a lot, so we can't promise the same results as in biofuel, ash and wood handling. We agree goals and success criteria together up front.
Book a site assessment below. We'll look at your process together and propose the target with the best payback – or tell you honestly if vision isn't the right tool. No obligation.
Contact
Not sure yet where to start? That's the most common starting point. Tell us about the incident or the doubt you have in mind – we'll help you find the target with the best payback, and tell you honestly if vision isn't the right tool.
Ville Laukkanen